

A working paper to promote further discussion and awareness for corporations to implement Strategic Corporate Innovation Management™. This article will illustrate how a Strategic Corporate Innovation Management™ [1] system can generate shareholder confidence[2] through the continues and timely introduction of newly anticipated inventive solutions that will successfully be adopted by a specified target market.
In this context, shareholder confidence is the result of a positive perception about a corporation, where the acquisition of shares is based on the expected or predicted financial performance of the corporation in the foreseeable future.
With the assumption that shareholder confidence has a direct correlation with share price, this research will illustrate there is also a direct correlation between the introduction of new inventions in the market (as corporate innovation) and the share price. With the share price as the common factor, there should then also be a direct correlation between corporate innovation and shareholder confidence.
Tesla Motors’ historic share price was analyzed in comparison with product release dates as a case study. It was possible to observe from the “share price vs corporate innovation” graph that shareholder confidence increased just before new inventive solutions were launched into the market. It was also observed that in order to sustain the share price value and market capitalization, it was important that the market successfully adopt the new inventive product as well.
As an additional benefit from this approach to deliver shareholder confidence through corporate innovation, the corporation itself will grow organically.
Overview
Most corporate executives strongly believe that shareholders only think in quarterly and annual financial performance reports, and do not care about a new breakthrough or disruptive innovations to be launched by corporations and how it will be adopted by the new market in the near future.
This creates the troublesome challenge where corporate executives almost always chase incremental and especially efficiency innovations for short-term gains, which includes:
- Reduction of OPEX (Operational Expenditure) to artificially increase profit margins to meet shareholder dividend distribution expectations, which hollow-out the corporation from core technologies and capabilities.
- Increased M&A (Merger and Acquisitions) activities to instantaneously increase revenue growth, but it is still very difficult to efficiently integrate different organizations to guarantee long-term value.
This implies that corporate executives prefer not to allocate an adequate budget or the necessary resources towards the development of a well-founded Strategic Corporate Innovation Management™ System to become a core competence of the corporation (Prahalad and Hamel, 1990). Not surprisingly, this explains why approximately only 6% (Christensen et al., 2016) (Hamel and Tennant, 2015) of corporate executives are satisfied with their corporate innovation performance.
With inspiration from Prof Clayton Christensen’s research, we know now that “sustaining innovation” (also known as “incremental innovation” or “performance improving innovation”) or “efficiency innovation” can only increase corporate profitability in the short-term to meet set shareholder expectations since it does not create any new markets. (Christensen and van Bever, 2014)
The only option to ensure corporate growth (and job creation) is either through “radical innovation”, “breakthrough innovation” or “disruptive innovation” that will enable organic growth from within the corporation to launch new technologies, products to new markets. (Christensen et al., 2019) (Mezue et al., 2015).
The concept of “market innovation” is where new markets are being developed through the lens of “Jobs-to-be-Done” theory. (Ulwick, 2017) (Christensen et al., 2016) (Adams and Burleson, 2018)
Therefore, Strategic Corporate Innovation Management™ as a core competence of the corporation is currently the only available option to deliver organic growth as a competitive advantage that can generate shareholder confidence.
The current challenge is to convince CEO’s and board members to significantly supplement their short-term M&A activities with a long-term corporate innovation growth strategy. This article will attempt to do this by analyzing the innovation and financial performance of Tesla Motors Inc.
Tesla Case Study
No corporate executive can deny that Elon Musk is considered to be one of the entrepreneurial geniuses of the 21st century, who accumulated enormous wealth from his own doing. Elon Musk even once suggested in a shareholder conference that he prefer shareholders who purchase shares (or stock) Tesla Motors for the long-term, from which one can surmise that he is primarily focused on delivering long-term innovations.
Tesla Motors Inc. was ranked the 6th “Most Innovative Company of 2018” by the well-known Boston Consulting Groups’ (BCG) annual ranking report. Thus, there is no doubt that Tesla Motors Inc. is one of the most innovative corporations in the world.
The proof is that Tesla Motors Inc.’s share price grew from the initial public offering (IPO) price of US$17 per share in 2010 to the latest share price (as of June 29, 2018) at US$342.95 per share, a 1,889% increase in value (Investopedia). This is phenomenal growth for a corporation that builds physical products, versus non-physical digital platforms.
Analyzing Tesla Motors Inc.’s historical financial growth metrics with revenue (sales) and earnings (profits) against strategic corporate innovation (as organic growth through the anticipated diffusion and adoption of new products to be launched into the market), the following paragraphs and financial graphs (see below) will respectively discuss and illustrate how Tesla Motors Inc. accomplished this level of value creation through (the lens of this article with) Strategic Corporate Innovation Management™ and the generation of shareholder confidence, which subsequently will increase share price and eventually sustain market capitalization growth.
Tesla Financials
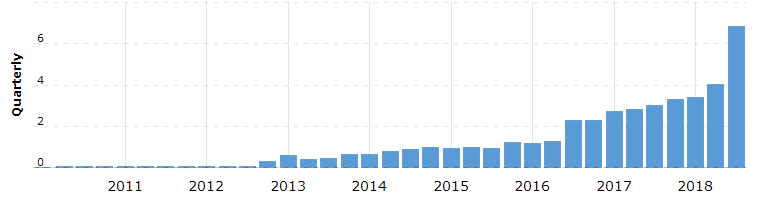
The following financial graph represents the quarterly corporate revenue generated by Tesla Motors Inc., ending (third quarter) September 30, 2018 (Source: Macrotrends):
- Revenue for the quarter ending September 30, 2018 was $6.824B
- Revenue for the twelve months ending September 30, 2018 was $17.524B
- It should be safe to assume that stable revenue growth was not fueled by any M&A activities.
- Revenue growth was a function of automotive sales based on internal organic growth.
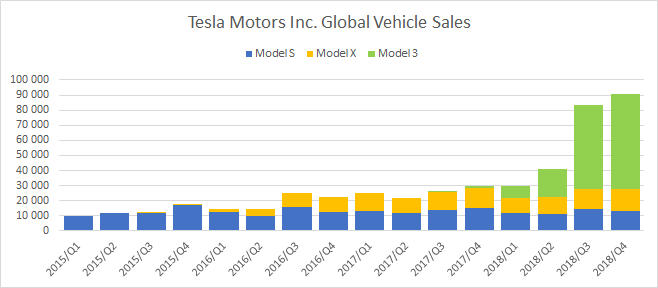
The following sales graph represents the quarterly global vehicle sales, ending (fourth quarter) December 31, 2018 (Source: CleanTechnica):
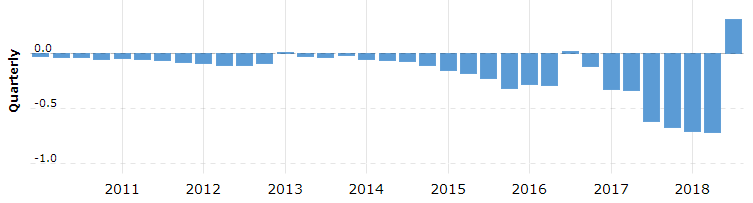
The following financial graph represents the quarterly corporate earnings (net income) generated by Tesla Motors Inc., ending (third quarter) September 30, 2018 (Source: Macrotrends):
- Net Income for the quarter ending September 30, 2018 was $0.312B.
- Net Income for the twelve months ending September 30, 2018 was $-1.791B
- It should be safe to state that net financial expenditure is due to the accumulation of capabilities as: knowledge, skills, assets (factories) and new processes.
- The net financial losses are not really lost, it was transformed from being a financial asset into a physical asset which can still appreciate in value (similar to invest in real-estate).
- The first significant profitable quarter was only achieved eight years after it was initially listed as a public corporation in 2010.
Tesla Share Price
Analyzing Tesla Motor’s historical share price since 2010 (see graph below), one will find two significant “spikes”, the first started early Q1 2013 and the second started Q4 2016. If revenue grew at a fairly stable pace while the financial losses also had fairly stable curves, what could have caused these spikes within the share price graph?
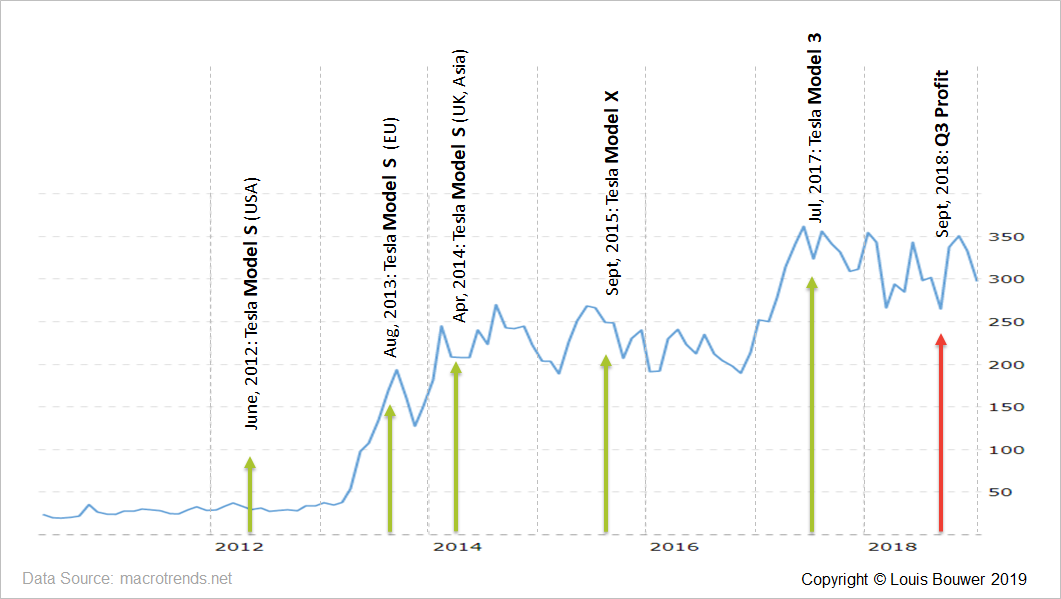
Thus, how did Tesla Motors Inc. accomplish such exceptional share price growth “spikes” without any significant net profits (earnings) or revenue growth without M&A activities? In fact, Elon Musk is known for driving organic growth through innovation where he develops everything throughout the value chain.
In order to understand this phenomenon, a non-financial and an invisible metric “Corporate Innovation” was brought into the analyses as an independent variable to add more insight into this phenomenon.

Tesla Corporate Innovation
From a Corporate Innovation perspective, Tesla Motors Inc. introduced (or unveiled) their products to the market as follows (as indicated on the share price graph as well) (Source: Wikipedia):
- 2009 – (March 26) Tesla Model S prototype was unveiled at a press.
- 2012 – (Feb 9) Tesla Model X prototype was unveiled and accepted reservations.
- 2012 – (June 22) Tesla Model S was introduced.
- 2016 – (March 31) Tesla Model 3 was unveiled and accepted first orders.
From a Corporate Innovation perspective, Tesla Motors Inc. launched its products into the market for sale as follows (as indicated on the share price graph as well) (Source: Wikipedia):
- 2008 – Tesla Roadster
- 2012 – Tesla Model S (USA)
- 2013 – Tesla Model S (EU)
- ·2014 – Tesla Model S (China, UK, Australia, Hong Kong and Japan)
- 2015 – Tesla Model X
- 2017 – Tesla Model 3
- 2020 – Tesla Roadster 2nd Gen
Tesla Corporate Innovation vs Share Price
From the Tesla Motors Inc. share price graph, the significant share price “spike” increase was due to the anticipated launch of a new electric automobile for a new market. From the illustrated share price graph, the following observation was made:
With the launch of the very first Tesla Model S in the USA, shareholders were still cautiously optimistic about the adoption of this new product for a new market.
- In 2012 the US was still very much a gasoline driven automotive market.
- One can consider that according to the “Diffusion of Innovation” theory (Prof Everett Rogers) that the “Early Innovators” (2.5%) purchased the Tesla Roadster since 2008.
- Sales of the Model S in the USA was mainly purchased by the “Early Adopters” (13.5%) of the potential market.
The share price spiked significantly since Q1 2013 with the anticipation of the Tesla Model S to be delivered in Europe in Q3 2013, and also from Q4 2013 to Q1 2014 for UK and Asia.
- After the Tesla S has been on the market for a year, it has proven itself as a quality automobile, delivering many benefits from being an electric vehicle.
- The European and Asian consumers could be considered a bit more environmental conscious who also have to deal with significant higher gasoline prices. Therefore, should be more motivated for an alternative automotive drivetrain.
- The launch of the Tesla S in EU and Asian markets can then be considered as the event where the corporation “Crossed the Innovation Diffusion Chasm” (Dr Geoffrey Moore) and thus being adopted by the “Early Majority” (34%) of the potential market.
The share price graphs also spiked from Q1 2015 to Q2 2015 with the anticipated launch (innovation diffusion) of the Tesla Model X into the market (innovation adoption).
- It is currently unknown why the share price dropped after the adoption in the market, almost back from where it started in Q1 2015.
- The delay with the production and launches of the Model X into the market could have influenced the share price significantly.
The second significant share price “spike” was with the anticipated launch (unveiled in Q2 2016 and introduced to the market in Q4 2016) of the Tesla Model 3. Thereafter, the share price was fluctuating around the US$300 per share mark.
- One may consider the sales of the Tesla Model 3 was made by “Late Adopters” (34%) of the potential market.
- Even though still very expensive, it was more affordable and thus could attract a larger segment of the automotive market.
- The significant share price increase “spike” started two quarters (6 months) before the official launch of the Tesla Model 3.
- This implies that the mere unveiling of a new product still will not instil any shareholder confidence. Only when shareholders truly developed the perception and believe that the new product will be delivered to the market, will the share price start to increase.
- The lesson for shareholders is to buy shares (or stock) in corporations that have an innovation strategy in place and who will launch new inventive products onto the market in a timely manner in the near future.
Concluding Remarks
Corporate executives must maintain shareholder confidence if they want to increase share price value and sustain market capitalization growth. The solution is to implement a Strategic Corporate Innovation Management™ System that can deliver new unique solutions to the market in a predictable, repeatable, profitable, sustainable and scalable manner.
An additional conclusion from this research was that the behaviour of shareholders appears not to be that much different from Venture Capitalists or Angel Investors. It suggests the biggest difference is mostly the preference in the level of liquidity of private vs public shares.
Notes
- This work was published as a Working Paper to initiate thoughts from a case study as a phenomenon, any comments or thoughts will be appreciated for future research.
- The Strategic Corporate Innovation Management™ System was developed by the author during his PhD research, will be published with his book on “Corporate Innovation Strategy Formulation” later in the year. Please give this article a “thumbs up Like” if you would like to be notified.
- The PDF document of this article can be found on the author’s LinkedIn profile page.
- Related work to read is “Scaling-up Corporate Startups” by Frank Mattes and Dr Ralph-Christian Ohr.
- The author will entertain consulting collaboration with your corporation.
Footnotes
[1] The Strategic Corporate Innovation Management™ Systems was developed by the author during his PhD research.
[2] Although the author does not support Shareholder Value Capitalism, it is, unfortunately, the current ecosystem corporate executive has to deal with. The author anticipates a shift to Customer Capitalism through Strategic Corporate Innovation Management™ during the new forthcoming industrial revolution.
References
- ADAMS, D. & BURLESON, S. 2018. What Drives B2B Organic Growth? In:INSTITUTE, A. (ed.). AIM Institute: AIM Institute.
- CHRISTENSEN, C. M., HALL, T., DILLON, K. & DUNCAN, D. S. 2016. Know Your Customers’ “Jobs to Be Done”. Harvard Business Review, 94, 54-60.
- CHRISTENSEN, C. M., OJOMO, E. & DILLON, K. 2019. Cracking Frontier Markets. Harvard Business Review, 97, 90-101.
- CHRISTENSEN, C. M. & VAN BEVER, D. 2014. The Capitalist’s Dilemma. Harvard Business Review, 92, 60-68.
- HAMEL, G. & TENNANT, N. 2015. The 5 Requirements of a Truly Innovative Company. Harvard Business Review Digital Articles, 2-9.
- MEZUE, B. C., CHRISTENSEN, C. M. & BEVER, D. V. 2015. The Power of Market Creation: How Innovation Can Spur Development. Foreign Affairs, 20.
- PRAHALAD, C. K. & HAMEL, G. 1990. The Core Competence of the Corporation. Harvard Business Review, 68, 79-91.
- ULWICK, A. W. 2017. Outcome-Driven Innovation® (ODI): Jobs-to-be-Done Theory in Practice. Strategyn.
Article by channel:
Everything you need to know about Digital Transformation
The best articles, news and events direct to your inbox
Read more articles tagged: Featured, Innovation