In Part Two, the most cited Return on Investment (“ROI”) attributes listed by DevOps Commentators were gathered together to create a list of the most popular metrics by which to measure DevOps success.
The research also identified groups of metrics which could be more popular at different levels of the organisation. These “lenses” were CEO level, CIO level and Manager/Team (see Part Two for details).
Now it is the practitioners turn to supply their preferred metrics. Will their preferences match those of the commentators? Will the differing lenses associated with seniority be seen?
Practitioner Discussions
Before looking at the data, the author also gathered information from discussions with and presentations given by people in the UK DevOps Industry.
It was pleasing to see that many of the attributes prescribed by DevOps commentators also appeared in conversation. The culture transformational journey was often mentioned as were the challenges; “changing culture is like changing the direction of an oil tanker”. A DevOps CEO remarked, “I am reminded of the Peter Drucker quote: ‘Culture eats strategy for breakfast’”.
Many practitioners agreed on the importance of “all staff having sight of the customer value being delivered”. Discussions about “what are DevOps’ KPIs?” were fairly unanimous in that it depended on the industry and circumstance in which DevOps was being applied. This matches the findings of NewRelic (2015) who stated the industry, company and “other variables” heavily influence the KPIs measured.
A consultant added a pragmatic note; “key metrics are the same for all (profit based) businesses; speed to market, cost and revenue”. He contested that “generating a bunch of stats will not make the CEO invest; they are (for) internal management”. A technical director warned “Don’t twist DevOps metrics to suit your own ends”.
The Practitioner Survey
During October to December 2016, requests were made to contribute to an online survey (found here) using posts in various areas of LinkedIn directed at DevOps practitioners and also to the London DevOps Meetups Group. This research work included the author presenting his initial findings at London DevOps #21 at IPExpo, Docklands.
Based on the list of metrics supplied by Commentators, Practitioners were asked whether they understood each metric proposed, whether it should be measured or whether they felt is was superfluous. Practitioners were also asked to add any metrics they felt were missing. The survey also attempted to see whether there were preferences to certain metrics based on seniority as well as understanding of DevOps practices. Finally respondents were asked to consider measurement in both DevOps and Non DevOps environments.

The Results
General Population Characteristics
Whilst it is fair to say that the results do not carry statistical confidence based on the volume of responses, they highlight trends which are worth comment (and potentially further research).
Demographically, the survey respondents were a fairly even spread of seniorities and levels of DevOps understanding which hopefully removes any skew towards particular responses.
Whilst there were some differences in the average number of attributes each IT seniority group prescribed as “not understood” or “not required”, the differences were modest, indicating a fairly common understanding of definitions across the Practitioner population.
Comparison of Metric Rankings
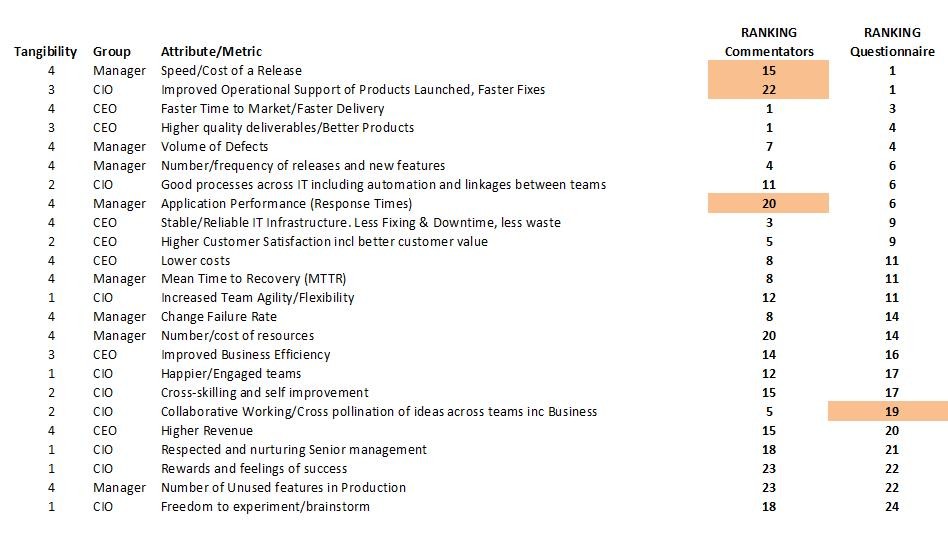
The table above show the results ranked in order of preference by Practitioners (far right column) alongside the original rankings of the Commentators to the left. Statistics fans among you will be keen to know the Pearson-Moment Correlation Coefficient is +0.43, indicating a modest positive correlation between the two bodies of opinion.
A super-summary of the results would be both groups understand the importance of fast, safe deliveries of constantly improving software, underpinned by a stable IT infrastructure – and that customer satisfaction is also important.
Although not easy to see in the table above, the Manager level metrics (discussed in Part Two) were the most popular with the Practitioner community with the CIO level metrics in last place.
Individual Metrics
Turning to the individual metrics, shown in orange in the table above are metrics where the difference in ranking between the two groups was greater than five places. It is intriguing to see Speed/Cost of a release, Improved Operational support and to a lesser extent Application Response Times, so in favour with Practitioners but not with Commentators.
Speed/Cost of a release is popular across all Practitioner seniority and experience levels, however the author believes there could be an interpretation issue as to the metric’s meaning. It should mean how much effort/cost is involved in the release itself– but perhaps it has been interpreted as the full end-to-end design-to-release process.
The Improved operational support discrepancy is equally baffling and possibly indicates DevOps Commentators do not believe DevOps practices improve this issue. The Practitioner’s opinion is however, not as clear-cut as it seems; Whilst regularly cited, the metric was also fairly prominent in the list of metrics that Practitioners (across all seniority levels) did not feel needed measuring.
Also of note is that Collaborative working (which in the author’s opinion is one of the key foundations of DevOps) is ranked fairly low by Practitioners. Does this indicate the one of the core DevOps messages is not being communicated clearly to all?
Comparing the rankings from practitioners and commentators across the three lens groups, there is good correlation at the CEO level, but only fair correlation at CIO and Manager Level. Based on the small number of metrics comprising each group, the large differences in individual metric rankings shown in the table emanating from CIO and Manager levels would cause this.
Tangibility
The challenge with intangibles persists, with Commentators and Practitioners mainly avoiding them or disagreeing on which are important.
[Each metric was ranked from 4 (Tangible) to 1 (Intangible) based on the work of Rememyi et al (1993) and Hares and Royle (1994)]
Viewing the table, the more intangible a metric is, the lower it ranked. In addition, intangibles were more likely to be listed as metrics which Practitioners struggled to understand or felt were not relevant.
Five of the top six “not understood” metrics came from the CIO attribute group – many being intangible metrics. The author suspected this was influenced by responses from inexperienced staff, but in fact it was constant across all roles and levels. The author was concerned that hygiene aspects such as “freedom to experiment”, “rewards and feelings of success” were not considered to be worth measuring. Yet the motivations of many staff I have worked alongside are very affected by these issues.
If DevOps is as “cultural” as it claims – and this certainly comes across in the Practitioner discussions, this is not enforced by the Practitioner’s survey responses. One discussion worth considering (based on these results) is whether the metrics being measured really do get to the cultural message. Or are staff simply paying it lip-service?
The questionnaire response around Intangibles raises further dilemmas for the organisation. In addition to being harder to measure, staff will need persuading to use them. Yet Petter et al (2012) are just one group who report that systems will yield both tangible and intangible benefit.
Did Practitioner Seniority affect the Metrics they prefer?
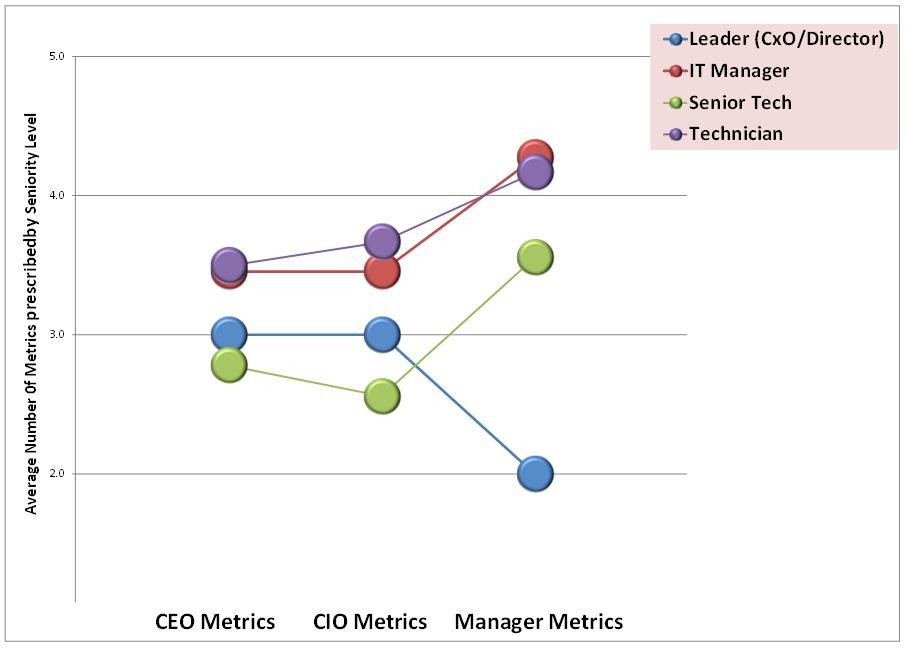
The survey indicates that seniority does indeed affect the metrics preferred. Whilst all groups select metrics from across the spectrum, the chart above shows that Leaders (blue circles) selected more CEO/CIO level metrics, whereas the other groups chose more Manager level metrics.
This lens preference result is very important as it could highlight possible conflicts when deciding how ROI metrics should be:
(1) Measured. Managers may feel their overall leader (who favours the CEO lens) choses performance metrics which do not reflect their team’s performance.
(2) Communicated. A technician informing the CEO that “we are fixing failures faster [A Manager Lens Metric]” might be less well received than a message of “IT is becoming more stable [A CEO Lens Metric]”. In fact there is the possibility that the (non-technical) CEO may interpret the first message as the system seems to be broken a lot.
When choosing a measurement strategy, it is critical the team understand and support what is being measured and it is communicated.
Other Points of Interest
Elsewhere in the survey the following points were seen:
There was a strong correlation in responses seen for DevOps and Non DevOps environments. However, Practitioners recommend using more metrics to measure DevOps installations.
In general, lower ranked attributes also appeared higher in the list of attributes which respondents did not understand or did not consider needed measurement. A fairly popular DevOps Commentator metric “Mean Time to Recovery” surprised the author when over 40% of Practitioners stated it was not required.
And Finally..
This is the final section of this four part series. I hope you have found it useful.
Hopefully by now, you will have noticed that although the subject under scrutiny for IT ROI measurement was DevOps, many of the challenges are common across the entire IT spectrum.
- It is critical to find measurement frameworks (note frameworks – you may need more than one) and metrics that fit your organisation.
- Consider your audience. Will they understand (and appreciate) your metrics proving ROI?
- Intangibles (as has been shown) are challenging for all. Yet they can unlock significant extra value from your IT projects.
- Looking at DevOps, the metrics prescribed by DevOps Commentators are sound and in general are supported by DevOps Practitioners. They also stand the test of scrutiny from academic models.
- There is a warning that the more cultural side of DevOps may not be recognised by staff or prioritised when considering measurement.
Article by channel:
Everything you need to know about Digital Transformation
The best articles, news and events direct to your inbox
Read more articles tagged: Featured, Frameworks
Popular Now
Related Articles
