
“Segmentation” will ring a bell with most Marketing Researchers but it can mean different things to different people. What is Segmentation?
Segmentation is a household word in Marketing Research but the term actually refers to several kinds of research, including qualitative.
In my experience, there are at least four types of quantitative segmentation.
A Priori Segmentation: Develops statistical profiles of consumers that help us understand and predict important marketing variables such as purchase frequency
Post Hoc Segmentation: Uses information collected from consumer surveys, customer data or other sources to classify consumers into groups that are relatively homogenous
Brand Segmentation: Reveals “clusters” of brands based on consumer perceptions or actual purchase behavior
Driver Segmentation: Identifies consumer groups with different priorities (“drivers”) with respect to one or more marketing variables, such as overall satisfaction or category usage frequency

Why Do We Do It?
Segmentation is one of the most important kinds of Marketing Research, and there are many ways it facilitates decision-making. Segmentation helps us:
- Understand what motivates consumer behavior in a product or service category;
- Uncover patterns of consumer behavior and motivations and link them to characteristics such as demographics;
- See how brands are positioned within different needs segments;
- Know how well brands meet existing needs;
- Identify unmet needs;
- Retool existing offers to appeal to a broader range of consumer needs;
- Enhance New Product Development (NPD);
- Focus Customer Relationship Management (CRM) more effectively; and
- Target consumers in Direct Marketing (DM).
Let’s now look at each of the four types of segmentation in a bit more detail.
A Priori Segmentation
In A Priori Segmentation we have a pre-determined target variable (dependent variable) we would like to understand or predict. This target variable in effect is a pre-defined segment.
Typical data sources are usage and attitude surveys, tracking studies and customer records, and one simple example would be examining category usage (e.g., heavy, medium and light users) by consumer demographics. The target variable, or A Priori segment, is user type.
Cross tabulations can be employed to profile these pre-determined consumer groups but A Priori segmentation also makes use of statistical techniques such as Logistic Regression and CHAID or newer methods popular in Data Mining and Predictive Analytics. Collectively, these tools are sometimes referred to as “Supervised Learning.”
They come into play because merely inspecting cross tabs may be insufficient, as they cannot account for interrelationships among the predictor (independent) variables.
Multivariate Analysis, e.g. modeling two or more predictorssimultaneously, can provide rich insights invisible to the naked eye. We can also develop statistical models for scoring new or potential customers as likely heavy, medium or light users, in keeping with our example.
Let’s have brief look at an example of A Priori segmentation. Men and women over age 18 were interviewed regarding energy consumption and related topics.
The survey included questions about a new kind of air conditioning system that is highly energy efficient and respondents also evaluated a concept for the system in terms of likes/dislikes.
A key question was Liking for the concept. A “tree” method called CHAID was used to identify respondent subgroups with the highest concept interest. Liking (Top 2 Box/Bottom 3 Box) was the target variable and nine demographic and behavioral variables comprised the predictors.
Interest in the new AC system was not high and just 21% indicated they liked the idea as described to them. Responses to open-ended questions suggested that some respondents had difficulty understanding the concept or found core claims hard to believe.
Thus some of the lukewarm interest probably resulted from the stimulus material itself and not the basic product idea. Furthermore, the CHAID analysis detected variation by respondent characteristics.
- Liking for the concept was highest (40%) among those without AC or who use it lightly and who are under age 30. Possible explanations are economic or greater concern about the environment.
- High income respondents who are not heavy AC users and live in wood frame houses had the second highest liking (33%). (Larger, wood frame houses are often more expensive to cool.)
- The metropolitan area in which a respondent lived was also associated with concept liking – interest was stronger in warmer climates.
Post Hoc Segmentation
In Post Hoc segmentation we do not have a pre-determined target group. Instead, our task is to discover consumer groups that have marketing meaning and can be used for various marketing purposes.
Post Hoc Segmentation utilizes information collected in consumer surveys or other sources, such as customer transaction records, to classify consumers into groups that are relatively homogenous and distinct from one another. Cluster Analysis is the core statistical technique used to identify these segments (clusters) of respondents.
The segments are often defined and profiled by consumer attitudes, consumption behavior and demographics.
The data can be sourced from consumer surveys, customer records or other data bases, or a combination of these in which “soft” attitudinal data are fused with factual data from customer transaction data bases (for example).
Derived importance obtained from tradeoff methods such as MaxDiff and Conjoint Analysis is another data source.
In Occasion-based or Motivation-state segmentation attitudinal data – often importance ratings – are tied to specific occasions or motivations since the occasion or motivation for shopping a category can determine what is most important in choosing a brand.
A classic example would be selecting a bottle of wine – our choice would probably be very different when the wine is to celebrate a promotion compared to when it is intended for cooking, and we would use very different criteria in making our selection.
K-means and Hierarchical Cluster Analysis historically have been the most common clustering techniques though newer methods, including those developed for Data Mining and Predictive Analytics, are becoming popular.
It would be quite an understatement to say there are many kinds of clustering methods as well as many ways to use each method.
To put some meat on these concepts, below are some highlights of a Post Hoc segmentation that was one component of usage & attitudes research among women on the topic of fashion.
Table 1: Post Hoc Segmentation Example
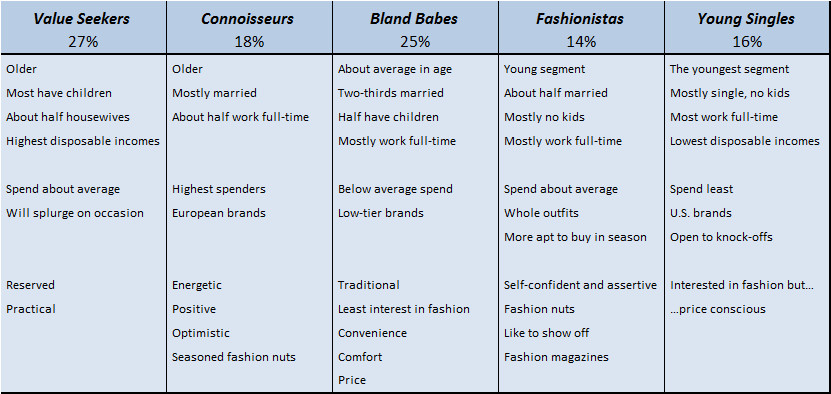
Key findings and implications of the research included the following:
- The client brand was undifferentiated from competitors’;
- It lacked a clear target;
- There was some indication of room to move up market through the introduction of brands not yet sold in the country researched;
- Channel strategy had been undifferentiated and needed to be better aligned with the brand portfolio; and
- Fashion magazines and Social Media needed to be used more strategically; current marketing was somewhat haphazard.

Brand Segmentation
As noted, Brand Segmentation resembles Post Hoc segmentation except that we segment brands rather than consumers. We identify groups of brands within a product/service category that are more similar to each other than to other brands in the category. We do this in order to reveal:
- The strengths and weaknesses of a brand relative to competition;
- Which aspects of a brand’s image are most relevant to consumers; and
- What opportunities exist for extending the product line or introducing entirely new products.
Brand Segmentation can make use of claimed purchases or brand image data from consumer surveys or actual purchase behavior from transaction records and panel data.
The analytics are normally quite simple – Cluster Analysis (e.g., AHC), Multidimensional Scaling (MDS), Correspondence Analysis, Principal Components Analysis and Biplots are common – and the results often presented in the form of a brand map.
Each method will give a somewhat different perspective of the market and the differences can at times be marked.
Correspondence Analysis, Principal Components and Biplots are most informative in the sense that they show us the attributes consumers most strongly associate with the brands, in addition to how the category is structured.
Correspondence Analysis differs from other methods in that it automatically adjusts for brand size effect and provides insights into the relative strengths and weakness of brands. This can be accomplished with other methods as well but is not the default.
Following is a short example of Brand Segmentation. Consumers who purchase ready-to-drink (RTD) non-alcoholic beverages were surveyed on a range of topics, including consumption of functional drinks. Brand image of the leading functional drink brands was also asked.
Hierarchical Cluster Analysis and Correspondence Analysis were conducted and in each case results suggested consumers tend to perceive the leading functional drink brands as falling into one or the other of two macro segments.
- Fun segment: Associated with attributes such as Youthful, Innovative, Unique Taste, Quenches Thirst and Suits Me
- Functional segment: Associated with attributes such as Nutritious, Natural, High Quality, Good for Skin and Good Ingredients
These findings helped the client better understand the reasons underlying the purchase patterns they had observed in actual purchase data.
Driver Segmentation
This last approach brings together Post Hoc Segmentation and Key Driver Analysis. It can be thought of as a blend of Cluster Analysis and Regression techniques and, in fact, a method known as Clusterwise Regression is sometimes used in Driver Segmentation.
More recently various forms of Mixture Modeling have been favored.
First, what is Key Driver Analysis? Key Driver Analysis is an all-purpose term for statistical modeling that tries to identify how much influence different variables have in driving some consumer variable of interest – purchase intention, brand choice or overall satisfaction, to name three examples.
For instance, a bank will want to know what service aspects are most important to its customers, e.g., Courtesy of staff, Website ease-of-use, etc… Another application would be in product testing, in which we try to identify the key drivers of liking or intention to buy and therefore ways the product can be reformulated or re-designed to increase sales.
Key Driver Analysis is typically a one-size-fits-all exercise, in which a single statistical model is built for all consumers in our sample. By taking this approach we assume that everyone has the same needs structure.
When this is felt to be unrealistic, the common remedy is to conduct analyses separately for pre-specified groups, for example within age group or by gender.
This “shotgun” approach has drawbacks, though. There can be many subgroups and we usually cannot know in advance which consumer groups are dissimilar in terms of their drivers. For instance, we might suspect people in different age groups have different priorities when shopping Category X, but that might not really be true.
The actual driver segments may not be directly observable and characteristics we can “see” such as age and gender often only tell us part of the story.
Finally, there is an elevated risk of chance results and differences that may seem important may actually be artifacts of our having run many separate models, often on quite small subgroups of consumers. The shotgun way can be a costly, time-consuming and precarious undertaking.
Ideally, we would be able to conduct our analysis on all relevant data simultaneouslyand uncover groups of consumers with different priorities. There are now sophisticated statistical methods well-suited for the task but as a rule they are very computer-intensive.
Fortunately, modern computers and software have advanced to the point this is now feasible even with fairly large data sets. Driver segmentation can be quite complex and time-consuming, however, and there will be situations in which distinct, actionable driver segments cannot be identified.
A negative finding is a finding, though, and may be surprisingly informative.
Let’s now look at an example. In a usage & attitude study, women were surveyed about various skin care products. Facial Cleansers were one of the products covered. In a section of the interview respondents rated Facial Cleanser brands they knew on a series of attributes and on future purchase interest.
Driver segmentation was conducted, with Purchase Interest serving as the dependent variable and the attribute ratings as the independent variables. Three driver segments were found and the highlights are shown in Table 2 below.
Table 2: Driver Segmentation Example
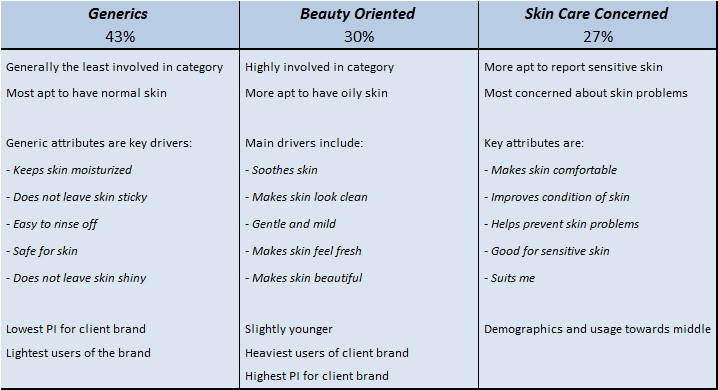
The largest group of consumers are not skin care fanatics and instead seek generic product benefits. On the other hand, as expected, many women are looking for specific product benefits beyond the basic “must have” product characteristics.
The client marketing team had sensed a need to refresh their brand and consumer priorities in this category were now more obvious.
Also, from an R&D perspective there is an engineering trade-off between formulating a product that offers certain benefits and one that doesn’t irritate or harm the skin, and these findings were incorporated into R&D planning.

Best Practice Tips
This has just been a small snapshot of a very big subject and for reasons of space I’ve omitted as much as I’ve included. Recommender Systems Handbook (Ricci et al.), for instance, is over 1,000 pages long!
For many clients, segmentation is one of the most valuable kinds of Marketing Research. It is important to recognize that it can pay off even when there is no simple and immediate connection to the bottom line. Marketing is much more than Direct Marketing and targeted ads!
When designing and conducting segmentation it’s important that you consider:
- Secondary data about the market;
- Previous marketing research conducted on this category;
- How you/your client define the category and why;
- You/your client’s perceptions of the brands in category;
- How you/your client are acting on these perceptions; and
- What you/your client most need to learn about this market.
Things to avoid include dumping data that have not been sufficiently cleaned into an algorithm or relying on the software to select the “best” model or cluster solution for you. Push button analytics is very risky.
When using customer records and other “hard” data, make sure you know what the data really mean – internal data bases are often shrouded in puzzling terminology and data maps may not be that informative or even misleading.
As with Marketing Research generally, who will be using the results, how the results will be used and when they will be used are of utmost importance. The data are critical and must link conceptually and practically with these considerations.
Last, but by no means least, please be careful when designing survey instruments, particularly attitudinal questions.
“Make things as simple as possible, but not simpler” has been attributed to Albert Einstein. Whoever was the original source, this is sound advice.
An earlier version of this article was published in the December 9, 2013, edition of Quirk’s e-newsletter.
Kevin Gray is President of Cannon Gray, a marketing science and analytics consultancy.
Article by channel:
Everything you need to know about Digital Transformation
The best articles, news and events direct to your inbox
Read more articles tagged: Data Visualisation, Featured, Statistics
Popular Now
Related Articles

