
This experiment clusters similar companies into the same group given their Wikipedia articles and can be used to assign a cluster to a new company. This is the Azure ML case study. The model is explained in detail below.
Description
This case study demonstrates how to use the K-Means clustering algorithm to perform segmentation on companies from the Standard & Poor (S&P) 500 index, based on the text of Wikipedia articles about each company.

Data
The articles from Wikipedia were pre-processed outside the Azure ML Studio to extract and partially clean text content related to each company. The processing included:
- Removing wiki formatting
- Removing non-alphanumeric characters
- Converting all text to lowercase
- Adding company categories, where known
For some companies, articles could not be found; therefore the number of records is less than 500.
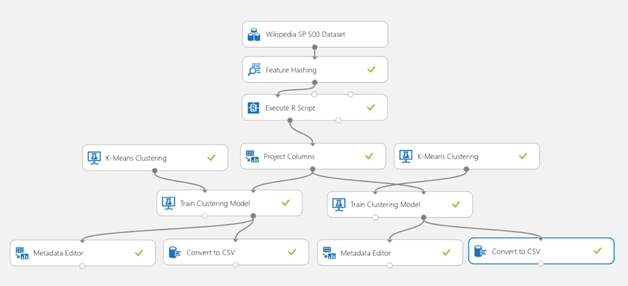
Model
Step 1) First, the contents of each Wiki article were passed to the Feature Hashing module, which tokenizes the text string and then transforms the data into a series of numbers, based on the hash value of each token.
Feature hashing works by converting unique tokens into integers. It operates on the exact strings that you provide as an input and does not perform any linguistic analysis or pre-processing.
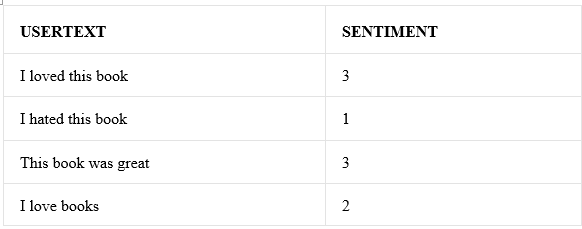
For example, take a set of simple sentences like these, followed by a sentiment score. Assume that you want to use this text to build a model.
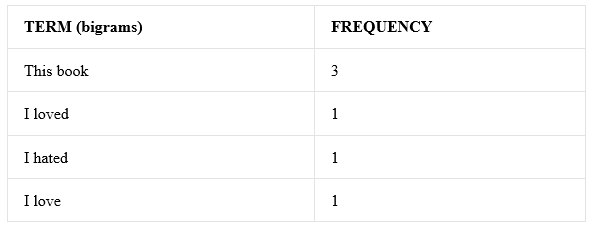
Internally, the Feature Hashing module creates a dictionary of n-grams. For example, the list of bigrams for this dataset would be something like this:
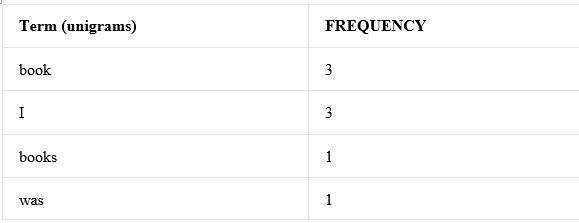
You can control the size of the n-grams by using the N-grams property. If you choose bigrams, unigrams are also computed. Thus, the dictionary would also include single terms like these:
After the dictionary has been built, the Feature Hashing module converts the dictionary terms into hash values, and computes whether a feature was used in each case. For each row of text data, the module outputs a set of columns, one column for each hashed feature.

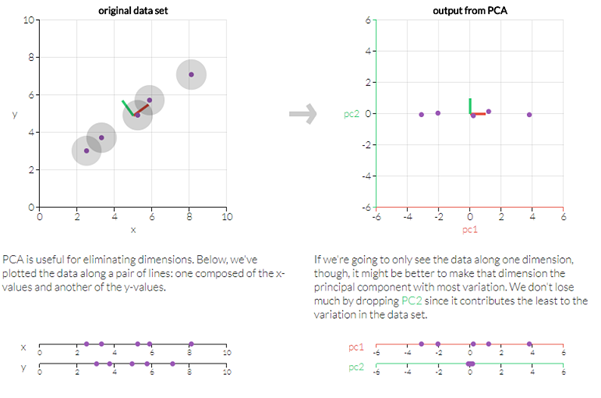
Step 2) even with this transformation, the dimensionality of the data is too high and sparse to be used by the K-Means clustering algorithm directly. Therefore, Principal Component Analysis (PCA) was applied using a custom R script in the Execute R Script module to reduce the dimensionality to 10 variables.
Principal component analysis (PCA) is a technique used to emphasize variation and bring out strong patterns in a dataset.
Step 3) By trial and error, we learned that the first variable (in the PCA transformed data) had the highest variance and appears to have had a detrimental effect on clustering. Therefore, we removed it from the feature set using Project Columns.
Step 4) Once the data was prepared, we created several different instances of the K-Means Clustering module and trained models on the text data. By trial and error, we found that the best results were obtained with 3 clusters, but models using 4 and 5 clusters were also tried.
K-means is one of the simplest unsupervised learning algorithms that solve the well-known clustering problem.
The procedure follows a simple and easy way to classify a given data set through a certain number of clusters (assume k clusters).
The algorithm is composed of the following steps:
- Place K points into the space represented by the objects that are being clustered. These points represent initial group centroids.
- Assign each object to the group that has the closest centroid. When all objects have been assigned, recalculate the positions of the K centroids.
- Repeat Steps 2 and 3 until the centroids no longer move. This produces a separation of the objects into groups from which the metric to be minimised can be calculated.
Step 5) Finally, we used Metadata Editor to change the cluster labels into categorical values, and saved the results in CSV format for downloading, using Convert to CSV module.
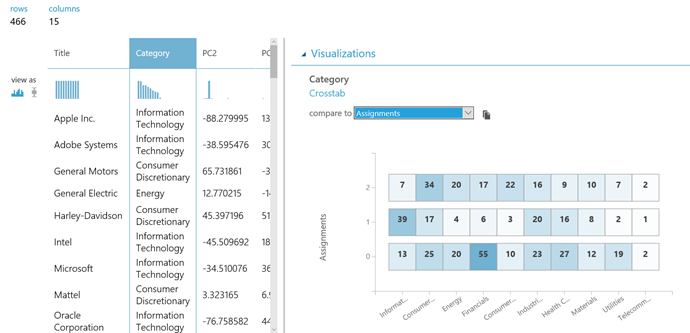
Results
To view the results from the sample experiment:
- Right-click the output from Metadata Editor and select Visualize.
- Plot the Category column (a known feature from the Wikipedia data) against the Assignments columns.
The three clusters that we obtained correspond roughly to three plausible categories. Note that the clusters are not clearly delineated.
Reference: https://gallery.azure.ai/Experiment/Clustering-Find-similar-companies-6

Article by channel:
Everything you need to know about Digital Transformation
The best articles, news and events direct to your inbox
Popular Now
Related Articles
