Few activities within corporations are as littered with traps, politics, egos and scheming as technology investment. Equally, few activities are as critical for the future survival of any organisation. In this simple guide, I will provide you with some basic things that I tend to think about.
TL;DR
- Be clear on your purpose.
- Understand the landscape.
- Realise that the landscape changes.
- Analysts are a good signal for the market but that may not be where you should invest.
- Diversity matters.
Introduction
Few activities within corporations are as littered with traps, politics, egos and scheming as technology investment. Equally, few activities are as critical for the future survival of any organisation. In this simple guide, I will provide you with some basic things that I tend to think about.
Before we start, I’d better explain how technology investment decisions are usually made — not the glossy Hollywood advert of financial sleuths performing magical tricks with holographic graphs driven by some half-sentient AI, but the everyday practice.
Most investments start with an executive listening to their favourite consultant or business guru or reading an analyst article about a company doing something. That thing could be investing in a new technology or reducing headcount through automation, or removing technical debt through a digital transformation or whatever. This “discovery” is followed by a gut feeling that “our company should do this”.
When that gut feeling is vocalised, it sets off a chain of events within the organisation. One internal group will look into the cost and feasibility of doing the thing, after which an ROI (return on investment) calculation is performed to determine how much value the thing must make, and finally, work is done to gather evidence to justify that the value will be created. This is then neatly packaged up in a business case, often with the help of favoured management consultants and it is rarely challenged and even less rarely based upon any form of reality.
The result? Well …
Standish Group’s CHAOS 2020 report found 66% of technology projects end in partial or total failure.
In “flipping the odds,” BCG estimated that 70% of digital transformation efforts fall short of meeting targets — a figure that can be turned around to 30% (according to BCG) as long as you hire BCG.
A 2021 McKinsey study shows that 69% of digital transformation projects fail.
In KPMG’s 2023 study, 51% of the 400 responding US technology executives said they had seen no increase in performance or profitability from their technology investments.
Do remember that executives tend to talk up their achievements because they are under pressure to show success, they may also be biased toward optimism and lack project postmortems. I would therefore caution that those figures are likely to under-report the actual horror of technology investment.
The solution? Well, according to BCG, it’s to hire BCG. In other cases, it almost always ends up being something about not being agile enough or something about execution or the need for more talented people or some other technology or using the wrong consultants. It is almost never that the entire investment strategy is flawed because it was built from gut feel.
Somewhat infamously, I was visiting the executives of a large communication company (a decade or so ago) when they explained to me their plan to build their own private cloud for about $1.2 billion. As you can guess this started with an executive reading an article and listening to their favourite consultants. I went through the plan, mapped it and announced that I could give them the same result for $25 million. When asked how, I simply said … pay me $25 million, I’ll sit on a beach drinking Margaritas for five years, and then I’ll phone you up and say, “We failed”. That way you’d save all the rest of the money.
Unsurprisingly, I was shown the door. More surprisingly, seven years later, one of the executives phoned me up at home and said, “I wish we’d paid you the $25 million”. I have no doubt that since their epic failure hordes of management consultants have been in there telling them it was something about not being agile enough or something about execution or the need for more talented people or … you get the picture. It was the pesky staff and not the glorious strategy.
So, in the hope that you will find this helpful, I will now tell you how I look at the question of investment in technology. This method is part of an ongoing research project of mine and is still very unproven but maybe you might find something that helps. For background, I’ve run a number of research projects which look at investment areas from finance to defence to agriculture to education to video gaming to construction to … well, 15 in total. In this discussion, I will use examples from my healthcare group.
Wardley’s unproven method of thinking about investment.
Step 1: Ignore the consultants, business gurus and analyst reports.
I’ll come back to why step 1 is important later. I’m not saying that consultants and analysts aren’t important, they are. But to begin with, we will ignore them.
Step 2: Gather some actual practitioners.
Ideally, you want to gather 60 to 70 practitioners in the field that you’ll examine, and you’ll need them for about 10 hours. These need to be practitioners, so in healthcare, you’re talking clinicians to people who make medical devices. For education, you’re talking about teachers and those who run academic institutions. You definitely want to keep down the number of management consultants sneaking in. Instead, I would take some of those fees you usually hand over to management consultants and pay your practitioners for their time.
Step 3: Ask them what matters.
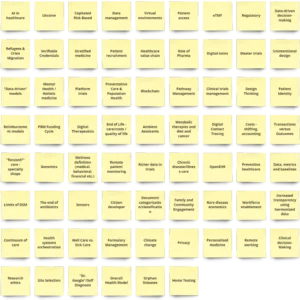
This is normally done on some form of virtual whiteboard (like Miro) and takes less than an hour to gather lists of things that people think are important. I’ve provided an example from the healthcare group.
Avoid discussing what is more important or why something is on the list. You want to time-box this exercise to one hour, and you can quickly lose all your time with arguments over whether we should focus on the role of pharma, the end of antibiotics, the use of remote patient monitoring or why Ukraine is on the list, etc. What you want is the list.

Step 4: Categorise the list.
You should spend another 30 minutes allowing people to categorise the list into themes. People are surprisingly quick at this. You’ll often find that the reason why things were originally written becomes clearer during this process, e.g., Ukraine is connected to refugees and crisis migration. Once you have your different themes, you want to spend another 30 minutes allowing people to vote on which themes are the most important and then allow them to self-organise into groups of 6 to 9 around those selected themes.
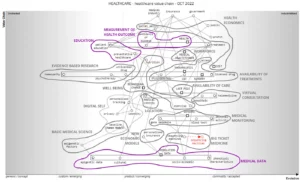
These selected themes we will call perspectives. They are nothing more than themes that the group considers significant. In the healthcare research project, one of the perspectives was the healthcare value chain (highlighted in purple).

At this stage, after 2 hours, you should have a list of themes built from all the areas the group thought were critical, a selection of those themes chosen because of their perceived significance, and teams organised around them. You want to break into smaller groups around perspectives so that the next few steps (5&6) can be run in parallel.
I’ll mark those steps with [Parallel] just as a reminder.
Step 5: Map the perspectives [Parallel]
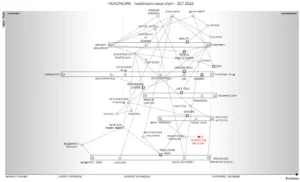
The mapping process is relatively simple. You identify the users, their needs, the components involved, and how evolved the components are. While it sounds simple, it leads to much discussion and discovery. It’s almost always the case that the process of describing a system requires several minds and it is very rare that one person has all the information needed.
When I say needed, do remember that maps are imperfect representations of a space. If you wanted to create a perfect map of Paris, it would have to be 1:1 scale, i.e. the size of Paris, which is not very useful as a map. Because they are imperfect, there is no right or wrong map; there are simply better maps, i.e. this is a better representation than that.
The imperfect nature of maps invites challenge. It’s very simple to look at a map and raise components or links that might be missing from the map. You can also add how you think things are changing, e.g, sequencing machines have rapidly become more industrialised (the red line on the map).
One thing you quickly learn about maps is that they are dynamic (constantly changing) and have no end state. We are constantly building higher-order systems. The map is all about discovery, options, and movement, hence my use of Deng Xiaoping’s phrase “Crossing the river by feeling the stones”.
This is also why we add a date to the map. The map of the healthcare value chain today would differ from that in October 2022, just as a map of Paris today would look very different from a map of Paris in the 16th Century.

Bizarrely, the type of discussions we can have with maps are much more difficult in the story-driven world of most businesses because, unfortunately, we have an entire industry persuading people that great leaders are great storytellers. What that means is that when you challenge a story — such as the business case for investing in the latest executive gut feel — you’re also challenging the leadership quality of the storyteller. You’re going up to the Emperor and declaring they have no clothes. By putting things onto a map, we’re never challenging the person, we’re simply challenging whether the map is a good enough representation of the landscape being discussed.
It usually takes about 5 hours for a group to get to a good enough map that they find helpful. Hence, with 60–70 people, after 7 hours, you should ideally have 6 to 10 maps of the space that you’re looking at from different perspectives.
Step 6: Identify areas of investment. [Parallel]
For each group, you ask them to identify on the map areas that you could invest in. At this stage, you’re not interested in whether you should invest or not, but rather what you could invest. In that discussion, they should label those areas on the map. Give the group about an hour to discuss this.
After which you want the group to highlight the three areas they would invest in if the purpose were to improve the entire system. It’s really important to emphasise that the purpose is to improve the entire system and not to make money or to make a return on capital. Again, give the group about an hour to discuss this.
For example, of all the areas highlighted for possible investment, from treatment availability to health economics, the three areas chosen to improve the healthcare system were measures of health outcome, education, and availability of medical data.

Step 7: Aggregation and comparison.
After 9 hours, with a group of 60–70 people, you should have between 6 to 10 maps of a landscape (such as healthcare) from different perspectives (such as healthcare value chain or refugees & crisis migration) and for each map, not only possible areas of investment have been highlighted but also those which the group believes matter most to improving the entire system.
The healthcare research group itself took a slower path (over a year between 2022 to 2023) with fewer maps when I was developing this process with them. The more recent groups, such as sustainability, took this much faster path which developed out of the original work. So now what?
Well, imagine no one has ever mapped Paris. You send a group to map it, and they come back with their map. You ask them what is important. They might tell you “Pierre’s Pizza Parlour” because they mapped Paris from the perspective of nice places to eat Pizza. The reason you send multiple groups to map from different perspectives is that you can then aggregate across all the perspectives to gain a better picture of the landscape i.e. you will quickly discover that the Eiffel Tower is a slightly more important feature than Pierre’s Pizza Parlour. In our maps, we’re looking for investment areas and in particular those selected as important across multiple maps.
At this point, the consultants and analysts become important. See, I said they had a use. Once you’ve aggregated all your mapping groups, you collect as many analyst/consultant reports that you can find, and then you aggregate what they think is important.
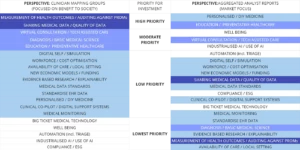
I’ve provided that aggregation for healthcare in the following table.

The table says that by focusing on the landscape of healthcare from multiple perspectives, the highest priority areas to invest in are managing and auditing of health outcomes (i.e., PROMs — patient-reported outcome measures rather than ClinROs — clinician-reported outcomes) and sharing of medical data. Of moderate priority is virtual consultation, diagnosis (basic medical science) and education / preventative healthcare.
This is different from the analyst focus, which has the highest priority as personalised medicine and preventative healthcare. Followed by well-being, virtual consultation and the use of AI.
Having done this across many industries, what has become clear is that the analysts & consultant aggregation tends to identify where the most money can be made. Personalised medicine and well-being are high-value markets. This was in early 2023, if I ran the same analysis again then I would suspect that AI / use of AI would be even higher.
But making the most return is not the same as improving the system. That’s why you need to consider your purpose when making investment choices. There are an awful lot of healthcare AI investments today — which is great for vendors, but if you’re trying to improve healthcare then you should probably be focused on PROMs.
In fact, there is so little focus on PROMs that I think healthcare is a misnomer. What we have are sickcare systems; we’re very good at treating symptoms but not necessarily making people healthy because we don’t even measure that outcome. If you have doubts over that statement, then ask a clinician — “Do you ever treat someone for symptoms and then send them back to the environment which made them sick in the first place? Does this create patients with re-occurring symptoms despite treatment? Do we ever deal with the cause, the environment which makes them sick?”
Now, I’m not slamming management consultant/analyst reports here. They can be very useful, especially if your purpose is to show the best possible financial return. We often lazily think that we should adopt that path because in the future, with growth, we will have more capital to fix other problems. Alas, once you’re on that path, you rarely stop focusing on the best possible financial return. Hence, you never fix the problems.
What I am saying is that if your organisation’s purpose is more expansive than “make the best possible financial return,” you may want to consider this in your investment choices.
My simple suggestions
I want to use the above to propose general lessons for technology investment. These are:-
- Be clear on your purpose. Making money or improving the system? This will change not only where you invest but, ultimately, what you measure. It’s worth being explicit on this.
- Understand the landscape. Making technology investments based on gut feeling has a poor record historically. Ten hours is quite a bit of time to spend learning about your environment, but it’s probably worth spending if you’re going to make any significant investment.
- Realise that the landscape changes. What matters will change as the landscape changes and that happens rapidly in economic and technological spaces. The maps above are from 2022. If I were to look at investment in healthcare in 2024, I’d undoubtedly get another group together and spend ten hours repeating the process.
- Analysts are a good signal for the market but that may not be where you should invest. Check your purpose. For reference, I also use various LLMs as proxies for analysts. ChatGPTv4, Claudev3 and Gemini tend to line up quite nicely on the more commercial market side with priorities of preventative healthcare, AI for healthcare, new business models for funding, digital transformation, telehealth and well-being.
- Diversity matters. Examine multiple perspectives of a market before making a choice. You’ll also need a diversity of people i.e. stop relying on your favourite consultant or analyst. Get a group of practitioners together and give them a way to communicate and challenge without the usual politics. Hence the whole Step 1 thing.
Research
I’ve taken a break from running these research groups while I set up my own business. Now that it’s more settled, I intend to start them up again.
I run these 10-hour stints over two weeks — three sessions (week 1 — Monday, Tuesday, Wednesday) and two sessions (week 2 — Tuesday, Wednesday), with each session being two hours long, 5pm to 7pm UK time.
The next landscape I will examine is “the future of work”.
I’ll start this on Monday June 17th. If you’ve practical experience in the space (i.e. remote working with teams, cell-based structures, culture, commercial HR, gov policy, organisational design, DAOs, running guilds on MMOs, impact of technology on the workplace, health and safety, security, law etc etc) and want to be involved, leave a note or drop me a line. You don’t need to know how to map, you will learn that along the way.
This work will all be creative commons.
Addendum
Q. How do you know when a map is a “good enough representation”?
A. When the team creating the map finds that the map is helpful in asking and answering questions about a landscape. Five hours is usually more than enough time for that to happen, even when most of the group begins by not knowing how to map and they are trying to map an industry.
Q. How do you choose which area to invest in?
A. The table provides signals of what is important. Once you’ve decided your purpose, you might choose to focus on one side or another or use a bit of both. For example, you might decide to focus more on virtual consultation because that can help improve the system of healthcare and is an area that the market values. Once you’ve narrowed down the area or areas that you’ll focus on, you’ll need to start looking at options within that space and start to consider the value/benefit versus cost of those options. What I want you to do, is to start that journey by thinking about the landscape rather than just operating on gut feel about some article that some executive read.
Q. 60 to 70 people for 10 hours could mean 700 hours of work. How do you justify that or even organise it?
A. I do this publicly, so people willing to be involved simply volunteer. Within a company, you might have to scale back the number of maps you produce. In practice, I spread this time over several weeks — usually two, sometimes three. It does, however, represent quite a significant investment in itself. You can easily spend $100k in wages on the effort. However, given the high failure rates of technology investments, I would suggest doing something else i.e. you should at least consider doing this before making any significant investments.
Q. I can’t get that number of people involved internally, what do I do?
A. Lots of things, but you’ll also have to make sacrifices.
i) By running it internally, you’ll have to accept that there will be less diversity in the mix, which means you’ll be more prone to internal bias.
ii) You can cut down the number of maps and the size of the groups. But you’ll get fewer perspectives and less diversity.
iii) You can run the mapping in serial rather than parallel. However, that will take more time because the same groups will create multiple maps. Again, you’d lose on diversity, but in this case, keep multiple perspectives.
iv) You can be more aggressive on the time boxes. You’d get a faster result but with less challenge and discovery.
v) You can use multiple LLMs as proxies for people and automate the process. I often map out a space with the aid of Claude v3, ChatGPTv4, Gemini, etc. However, be mindful that they are trained on available data and tend to lean towards what the market values (i.e., where most publications can be found).
If you wanted to, one person with a few LLMs could do this alone in an hour. This would limit the challenge, diversity and perspectives whilst introducing a more commercial bias. But at the very least, they would have considered the landscape.
LLMs are not bad (I happen to like Claude v3), and I often use them to map out numerous topics, including books. For example:-

However, one word of caution. In my experience, the fastest route to building situational awareness around a space is to get a large group of people together to map collaboratively around different perspectives. Your group acts as a “network” but the most valuable insights come from the intersections and discussions between practitioners in that network. The maps are just the medium by which you communicate this. If you isolate the practitioners, then you lose this.
Q. Save money on consultants, hire Simon?
A. Lol. That’s not the point. These are research efforts because I’m passionate about situational awareness and exploring spaces. Hence, it’s all creative commons. Outside of research, my major project and passion is moldable development and the exploration of systems. I’m working with Feenk on this. If you’ve not played with Glamorous Toolkit … well, I’m rapidly becoming biased. There is so much good stuff, including example-driven development.
I also work for a very limited number of clients on a retainer basis, but that has to do with much broader things about mapping. I’m not actively looking for any more clients — that time has been and gone. So no, it’s not about hiring Simon.
If you want to learn more on this, I’m writing a book on this approach (creative commons, share alike).
This post is provided as Creative commons Attribution-ShareAlike 4.0 International by the original author, Simon Wardley
Article by channel:
Everything you need to know about Digital Transformation
The best articles, news and events direct to your inbox
Read more articles tagged:


