As market uncertainty continues and economic recession looms, corporate leaders are rethinking their innovation portfolio objectives. Nobody can reliably predict how deep the downturn will go or how long it will last, but, until the market stabilizes, the prudent strategy for many is a shift in strategy from growth to productivity.
What does this mean for portfolio decision-makers? You no longer prioritize projects solely on revenue potential or NPV when deciding how to allocate investment. Productivity metrics that look at “bang for the buck” now take center stage. This means tilting the scales in favor of those projects that utilize fewer resources and, for the time being, throttling back on projects that will take three or more years to produce a return.
“Bang for the Buck”
When strategy shifts, the evaluation criteria for selecting and prioritizing projects shifts as well. Common project valuation methods like revenue, NPV, and risk adjusted NPV (eNPV), designed to maximize the value of the innovation portfolio, tell part of the story. Productivity metrics take the analysis a step further by maximizing portfolio value relative to a fixed budget. For example, metrics like expected commercial value (ECV) factor in success probability and subtract out development costs, thus penalizing resource-intensive, lengthy projects that don’t show an outsized return (Note: Development costs are those delivery and launch costs remaining for the project. Sunk costs already spent are not relevant to the funding decision.).
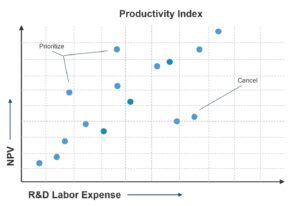
When in belt-tightening mode, you can take the above approaches even further by dividing your NPV or ECV by the company’s constraining resource. For technology-driven companies, this is typically the remaining R&D spend or, more precisely, R&D labor (expressed as dollars, FTEs, or person-days). For capital intensive businesses that require expensive new production equipment, this is capital spend. Use this productivity ratio to prioritize projects and optimize portfolio value, favoring projects that produce the greatest “bang for the buck”.
The following graphic captures project portfolio NPV versus R&D labor (the constraining resource in this case). Note how this view is used to drive actionable decisions.

It’s important to note that the optimal productivity metrics will depend on the specific circumstances of each project, the company’s capacity constraint, risk appetite, and overall strategic imperatives. The best approach is to use a combination of metrics to make a more informed decision.
One of our clients, a leading medical device company that supplies products for elective surgeries, was hit hard by the pandemic and needed to quickly rebalance their portfolio. Faced with a reduced R&D budget, they used the productivity index to re-prioritize, cancelling those projects with the lowest productivity scores and those lacking evidence that they solved a critical, underserved customer need.
Adjusting the Investment Mix
While shifting the strategic focus to productivity might be the priority during a downturn, it is important to do so without mortgaging your future. Cutting too far back on longer-term, new-growth projects can leave an insurmountable gap when economic conditions improve. Rather than cancelling new-growth projects altogether, continue to stay close to your customers to determine their emerging unmet needs, and use metered funding to run low-cost customer experiments to validate opportunities with a longer-term pay off. While the investment balance between core and new-growth innovation will change, it still needs to be an ‘and’ and not an ‘either/or’.
Leadership’s Role
One of the more critical roles for corporate leaders is to connect strategy to funded projects while ensuring that resources are allocated accordingly. Clayton Christensen and Michael Rayno point out in The Innovator’s Solution, “If the values that guide prioritization decisions in resource allocation are not carefully tied to the company’s deliberate strategy (and often they are not), then significant disparities can develop between a company’s deliberate strategy and its actual strategy. Actively monitoring, understanding, and controlling the criteria by which day-to-day resource allocation decisions are made at all levels of the organization are among the highest impact challenges a manager can tackle in the strategy development process.”
Portfolio management, the discipline corporate leaders use to dynamically plan, align, and optimize investment, serves as the link between corporate strategy and project execution. When strategic priorities shift from growth to productivity, the metrics used to make innovation project funding decisions must shift as well. At some point, economic conditions will improve. Acting now to rationalize and rebalance your portfolio with a focus on productivity will help you survive the downturn and leave you prepared to win when good times return.
Originally published on LinkedIn and republished with permission. Image Photo by fabio on Unsplash
Article by channel:
Everything you need to know about Digital Transformation
The best articles, news and events direct to your inbox
Read more articles tagged:


