

Part One introduced the research work as well as briefly describing the concept of DevOps. It hinted at some of the challenges that would be faced by any organisation in proving Return On Investment (ROI). In this article we look at the KSFs recommended by the DevOps commentators.
Part Two: Revealing The Key Success Factors Prescribed by DevOps Commentators
Research Method
Before analysing the results, it is worth understanding the research process.
During the period March-August 2016, eighty-eight DevOps papers/blogs/publications were reviewed. These came from many sources. Some sources were academic (EbscoHost, Emerald-Insight), others were acquired via search engines. A very useful “source” were recommendations and references made to other articles within the publications themselves [Often the sign of a good article is how often it is mentioned by others]. Articles which explicitly discussed measurement or success factors were selected for further study.
Once selected, articles were read again (and again!) and a list of success-factor metrics was compiled (and totalled) allowing a list of most cited metrics to be created. As with all research of this type, there is room for error and interpretation, however the goal here was to segregate the most popular metrics away from those that only appeared occasionally.
In the end around 25 articles were used dating from 2010-2016 as well as data from a handful of surveys including the last two Puppet Lab (2015, 2016) surveys.
The results of this work were shared with the London DevOps Meetup Community during two of their meetings at the end of 2016.
The Results
Below is the results table. You will see that metrics have been grouped into one of three groups. The reasoning for this is explained below. You will also see that commentators recommendations have been split up from those metrics seen and cited in surveys (also discussed).
First, have a browse through the recommended metrics..
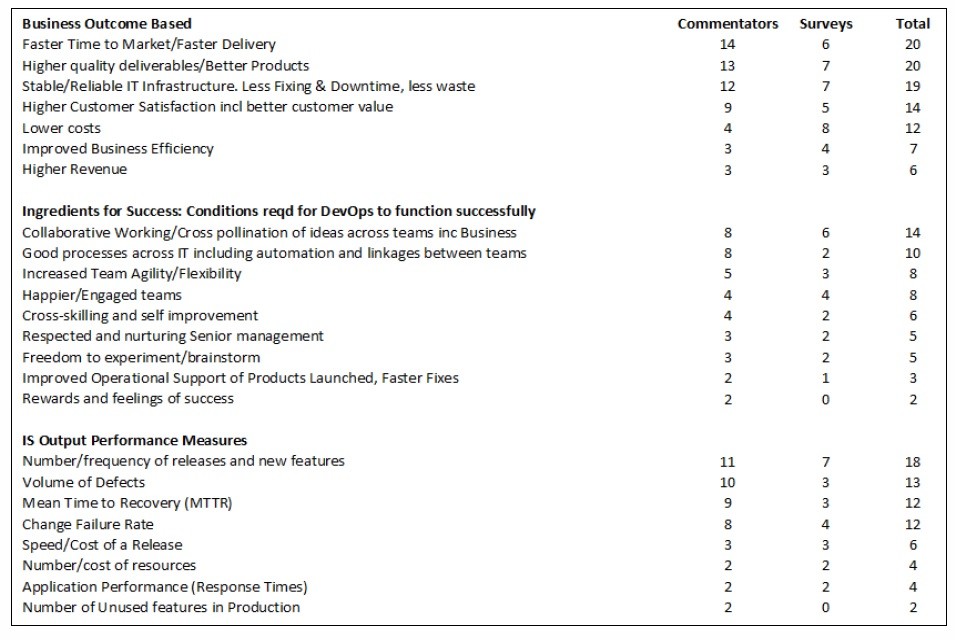
Examples of other metrics seen in lower volumes included security, change in user-base size, ease of replicating production data and customer churn rates. These may well be very important in your organisation but were not seen that often in the papers reviewed.
Commentators and Surveys
I have distinguished these two types of publications as they yield subtly different results. Whilst the commentators are normally making recommendations, the surveys sometimes are reflecting reality as seen by the respondents. So less prescriptive and more descriptive.
Analysis: Value is in the eye of the beholder..
In the first of these articles, I mentioned that value and benefit can depend upon your point of view.
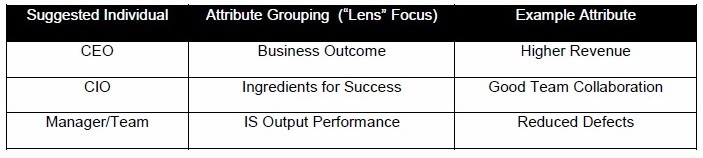
In the above table, I have grouped the metric recommendations made into three sets. These sets reflect the stakeholder’s viewpoint (often referred to as “lenses”) in reviewing success, or what needs to be present for success.
By looking through the eyes (lens) of the individuals suggested (CEO,CIO, Manager), you get a very different view on the success factors that may interest these individuals. More on this in later articles…
As with any attempt to categorise items into groups, there are some which could be argued should belong to another group – or possibly should exist in two. A few may well move groups in your organisation but the overall principle remains.
What do the groups tell us?
Using this kind of grouping allows some key messages to emerge:
Business Outcomes Group (“CEO Group”)
Business Outcome attributes were often the most commonly prescribed by commentators and surveys. This is a very positive statement on the quality of DevOps commentary as it demonstrates commentators understand that importance of using measurement which businesses understand. From a strategic perspective, they guide IT towards the organisation’s business goals.
Within the attributes proposed, there is a clear message. Create high quality, reliable products and get them to the customers quickly.
It is interesting that “lower costs” are seen as the biggest KPI from the surveys, however although prescribed during the earlier years of DevOps by commentators, this has now ceased. Possibly commentators see delivering against the main objectives and reducing costs, as an unlikely partnership.
Ingredients for Success Group (“CIO Group”)
Cross-collaboration across all teams (IT and Business) is seen as the most important metric (this mirrors the transformational messages recommended by Ward and Daniel (2006)). This is backed by good operational processes and agility/flexibility. In some ways, these metrics feel a little like a health-check in that their presence will lead to a successful DevOps intiative.
Note that many of the attributes are intangible and as discussed in the first part of this series these could prove challenging to measure for organisations. This may explain why many are less popular with Commentators.
IS Output Performance Group (“Manager/Team Group”)
These are very much “engine room/production line” metrics. Measurements are highly tangible with four dominant metrics prevalent, with the main KPI “number of releases/new features”. However it is worth noting the other popular metrics all refer to IT failure.
Food for Thought
Do you use these metrics or do you hear them in your organisation? How do you move between the different groups? Do staff also move through the metric groups with full comprehension?
In a later article in this series, we will look at whether seniority-level affects the type of preferred communication and levels of interest.
For now, if you let one of your Development team explain the ROI potential of DevOps to your CEO, what do you think would happen?
In isolation, these metrics appear sound, but in Part Three the metrics are tested in differing business situations (strategic, operational, measurement accuracy (tangibility) using appropriate academic models. Are there any glaring anomalies?
Do Take part in the survey!
Whilst the dissertation is complete, the data is still very live. Please take 5 minutes to fill in the DevOps ROI Survey. You can then compare your responses to the general population in later parts of this article.
Use of this article:
By all means print, share and discuss with your colleagues. If you wish to republish any part of it, please add the following reference to your publication.
Linwood, D. (2017) Which metrics assist in DevOps proving its ROI? (With assistance from academia). Part Two. [Web-log] Retrieved from https:/uk.linkedin.com/in/davidlinwood
References:
London DevOps Meetups https://www.meetup.com/London-DevOps/
Ward, J., & Daniel, E. (2006). Benefits Management, John Wiley & Sons: Chichester.
About the Author:
Having spent thirty years in the IT industry in the Banking/Insurance sector, working in IT Development, Support, Operations and Technical Architecture areas, most in Leadership roles. I have been lucky enough to have had a short career-break which has enabled me to complete my studies for an MSc in Management at Ashridge [Hult International] Business School. What you see is a result of that effort.
Article by channel:
Everything you need to know about Digital Transformation
The best articles, news and events direct to your inbox
Popular Now
Related Articles


