

Having discussed the challenges of IT success measurement in Part One and identified the success metrics recommended by DevOps commentators in Part Two, this instalment seeks to add academic “colour” to the picture by aligning the DevOps metrics with known academic models.
Warning! This article is a bit more heavy going than others in the series, but persevere with it and hopefully it will be of benefit to you.
Why Test the Metrics?
There are a number of reasons.
First, to check the validity of the metrics suggested by the DevOps commentators. Are the metrics compatible with academic models and theories which themselves look at different aspects of IT success?
Second, an individual metric is all very well by itself, but it will work better when placed within a measurement framework? I will assess two of these.
Third, by highlighting academic theory, it may help you assess how your organisation looks at performance measurement. This will help you to plan how you will measure and communicate DevOps ROI.
Finally from an academic perspective, is DevOps moving into an area for which current success models do not operate? It is making academic thinking obsolete?
Research Method
During the period March-August 2016, 67 academic papers/publications were reviewed. These came from both academic and more general search-engines.
A common and respected research strategy is to look for articles cited by other academics. The DeLone and McLean Information Success model dominates the framework area and was selected for this reason.
To validate the suggested DevOps metrics, I used a selection of academic models, a few of which are discussed briefly in this article. The idea was to use models which reflected different perspectives within an organisation, such as strategy, operations etc.
Recommended Reading
I have included references for the models cited in this article. The articles are all well written and are pretty accessible. The beauty of academic structure is you can spend a few seconds reading the abstract and the conclusion (which gives you an overview) before deciding whether to dive into the meat of the article. So do have a browse.
Matching Metrics with models
As discussed in previous articles, it is quite possible that you may consider some of the matches between the models and metrics differently. Welcome to the world of academic debate! Despite the odd adjustments that you would make, do consider the overall themes and conclusions which I believe, remain intact.
1.Strategy
In Part Two, I discussed differing stakeholder lenses. If we consider the metrics that form the CEO metrics group against a strategic model such as Treacy and Wiersema’s Value Disciplines (1993), we can see the DevOps metrics are spread nicely across the three strategic alternatives.
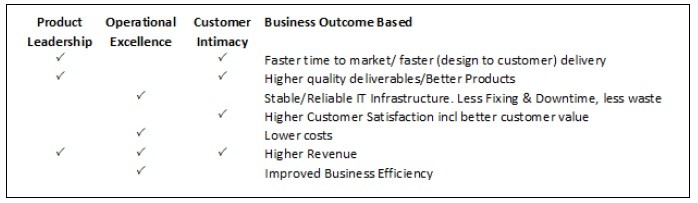
Note this is a very simplistic application of this model, however it is encouraging that DevOps metrics appear in all three strategy “paths”.
2. People/Process/Technology
Many strategy and operational models group organisational functions by People, Process and Technology. The Information Technology Infrastructure Library “ITIL” is one, some versions of the Target Operating Model is another.
The table below looks at how the DevOps metrics consider people, process and technology. The metrics are grouped using the “lens” viewpoints discussed in part two.
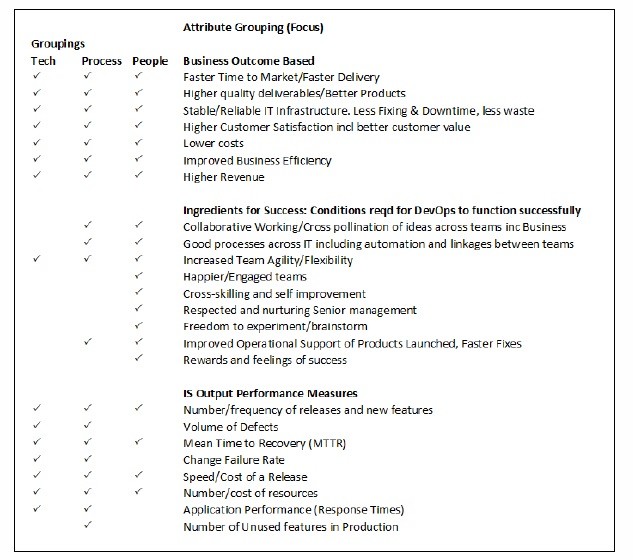
When reviewing the results throught the metrics/lens groups we see:
All of the Business Outcomes Group (CEO) metrics have aspects for which people, process and technology contribute – which is to be expected at a strategy level.

The Ingredients for success (CIO) group has a strong bias towards people and process. This was identified by a number of DevOps commentators and it is pleasing to see it here (As discussed previously, in theory it would be possible “to do DevOps” without using an additional technology).
The IS Output (Manager/Team) group has bias towards technological and process based metrics, which at an operational level should be expected.
3. Tangibility
As discussed in previous articles, there is evidence that a metric becomes harder to measure the more intangible it is. Each DevOps metric was scored using models based on the academic work of Remenyi et al (1993) and Hares and Royle (1994) (Summarised in the chart shown to save space).
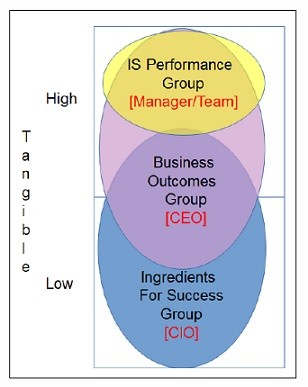
By grouping the metrics according to their metrics Grouping (CEO, CIO, Manager/Team), the conclusions are that the “Manager/Team” metrics are very tangible. The “CEO” Group has mixture but is broadly tangible.
However, there are warnings that many of the “CIO” group metrics are fairly intangible. This could prove a challenge for some organisations when attempting to assess performance.
Applying the metrics to IT measurement frameworks
This section looks at how well the metrics populate a couple of the well-known success measurement frameworks.
1. The DeLone and McLean Information System Success Framework
Probably the most famous IT success model framework is by DeLone and McClean (Revised, 2003). Much debated in academic circles, the model has seen a number of revisions although its authors resist regular pressure to revise its simple six dimension structure.
The six dimensions are:
- System quality – reviews the technical success.
- Information quality – reviews the success in conveying the intended meaning.
- User satisfaction – tracks the utility a user gains from system usage, which in turn can influence subsequent usage of it (see #4).
- Related to #3, is a split dimension known as “Intention to Use / Use”. This is measuring what makes an individual use a system repeatedly. They may be compelled to – but they all may like using the system.
- Service Quality – overall support provided to the consumer.
- Net Benefits – which measures the overall benefit derived by the user or the organisation from the system.
There is an additional complication (not discussed in this article), that each dimension can only influence certain other dimensions in specific ways.
The model needs to be reinterpreted slightly to link more closely to DevOps metrics. This is understandable when you consider DeLone and McLean’s model is measuring system success, whereas DevOps is a collection of methodologies and behaviours which builds systems.
The metrics suggested by DevOps commentators were matched against the Model’s dimensions. By reinterpreting the original dimension meaning of “Information Quality” to include “management of code, artefacts and associated data”, many of the DevOps metrics can match one of the six dimensions.
As discussed, with DevOps not being a system per se, I believe there would be no matches with the “Use/Intention To Use” dimension. However of note is that many of the intangible metrics are not catered for by this framework.
Does the model enforce the debate about stakeholders Lenses? (Discussed in Part 2).
Yes it does (Here is a brief summary).
CEO Group Level: The DevOps metrics in this group fall into most of the model’s dimensions, however matches with the “Net Benefit” dimension are predominant. As “Net Benefit” is defined by DeLone and McLean as the overall benefit and organisation would experience, this is to be expected.
CIO Group Level: There are matches for Information, Systems and Service Quality dimensions but there are many DevOps attributes which focus on management/team aspects for which no dimensions exist. The missing framework dimension of management in the success model has been identified by academics such as Seen, Rouse and Beaumont (2007).
Manager/Team Group Level: As might be expected, the predominance of matches with System and Service Quality dimensions suggesting a more operational level.
In conclusion, there is a fair match between the DevOps metrics and the framework but it is by no means perfect.
2. Balanced Scorecard Framework
Most people will have come across a Balanced Scorecard at some point in their careers and Kaplan and Norton’s 1992 framework is still widely used.
Benefits of the framework include that it allows tangibles and intangibles to be measured together, it can track goals of varying timespans and it allows IT and business measurement to be blended together. Another positive aspect is that it can express strategy as goals, which can be subsequently measured.
Its weakness is apart from general pointers for measurement, there are no empirically validated success metrics recommended. This means organisations must decide what to measure. With DevOps being new, getting the right measurement is critical.
There are a number of IT specific balanced scorecards prescribed by various commentators and as seen before, many struggle with matching up all the intangible metrics proposed by DevOps commentators. However some come close. Martinsons et al (1999) IT model refers to benefits from “internal process” – which could encompass many of the softer team aspects – but it is not specific. Other Balanced Scorecard frameworks including Shang and Seddon (2000) cover the more popular intangible metrics suggested by DevOps commentators, but it is still not a complete match.
Conclusions:
In general, the DevOps metrics suggested for measurement by commentators are sound. A theme running through these articles is the challenge of measuring intangibles, although frameworks like the Balanced Scorecard are more accommodating. You will need to consider the depth to which your organisation values the measurement of cultural benefit of DevOps.
Finally from an academic perspective, the pressure on DeLone and McLean to revise their success model framework remains. The model helps inform DevOps initiatives on areas where value can be added, but the model needs tweaking to add managerial aspects.
It not uncommon for academic models to highlight aspects of organisational behaviour which are not a complete fit with your organisation. Alas, the recommendation from academia is probably one which you have already arrived at yourself: “use more than one model”.
In Part Four:
OK, it’s your turn. When questioned, what were the metrics that you, the IT Practitioner community deemed important? Secondly is there any difference in metrics chosen when considered IT seniority or practical understanding of DevOps?
Resources
Ashridge Executive Education at Hult International Business School
London DevOps Meetups
References
- DeLone, W. H., & McLean, E. R. (2003). The DeLone and McLean model of information systems success: A ten year update, Journal of Management Information Systems, 19(4), 9–30.
- Hares, J., & Royle, D. (1994). Measuring the Value of Information Technology. Chichester: Wiley.
- Kaplan, R. S., & Norton, D. P. (1992). The Balanced Scorecard: Measures that Drive Performance. Harvard Business Review, 70(1), 71-79.
- Martinsons, M., Davison, R., & Tse, D. (1999). The balanced scorecard: a foundation for the strategic management of information systems. Decision support systems, 25(1), 71-88.
- Remenyi, D., Twite, A., & Money, A. (1993). Guide to measuring and managing IT benefits. New York: Blackwell Publishers, Inc.
- Seen, M., Rouse, A., & Beaumont, N. (2007). Explaining and Predicting Information Systems Acceptance and Success: An Integrative Model. European Conference on Information Systems (ECIS 2007). Proceedings. Paper 127.
- Shang, S., & Seddon, P. B. (2002). Assessing and managing the benefits of enterprise systems: the business manager’s perspective. Information systems journal, 12(4), 271-299
- Treacy, M., & Wiersema, F. (1993). Customer intimacy and other value disciplines. Harvard Business Review, 71(1), 84-93.
- Ward, J., & Daniel, E. (2006). Benefits Management, John Wiley & Sons: Chichester.
Article by channel:
Everything you need to know about Digital Transformation
The best articles, news and events direct to your inbox
Popular Now
Related Articles

